
FFI Newsletter: March 2016

Photo: Adam Cohn
2015 Annual Report Features Fortification's Impact on Nutritional Anemia
Also see revised estimates of fortified flour and rice
Last year was an exceptional year for documenting how flour fortification can reduce the prevalence of nutritional anemia. Studies were published, videos were created, and blogs were produced to reflect the new information. We borrowed a headline from the Milling Journal and titled our 2015 annual report Defeating Anemia to reflect these accomplishments.
The research noted that fortification programs are effective if certain criteria are met. These criteria include using recommended iron compounds at recommended concentrations, ensuring that programs are well implemented and monitored, and optimizing the program’s coverage and consumption.
We did not study the effectiveness of fortifying flour with folic acid to prevent neural tube defects because that is already well documented.
Data on countries’ monitoring programs are included in Defeating Anemia: 2015 Year in Review, and we will expand upon this data collection in the future. Two new monitoring resources are also planned for dissemination in 2016.
A global measure of success is the percent of industrially milled wheat flour, maize flour, and rice that is fortified. These percentages did not change considerably from 2014 to 2015.
“The static figures in the percent of grains that are being fortified represent a challenge for all of us,” said Scott J. Montgomery, FFI Director. “It’s a huge achievement for a country to pass fortification legislation, but the programs have to be well-implemented for people to experience the health benefits.”
The percent of fortified, industrially milled grains in 2014 and 2015 is in the chart below, based on our estimates as reported in annual reports. See the Defeating Anemia: 2015 Year in Review for more data and details on how we calculated these estimates.
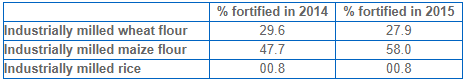
Egypt has stopped fortifying wheat flour, and this represents a 4.7 million metric ton decrease in fortified flour. This is a major factor contributing to the decreased estimate of the percentage of fortified wheat flour.
The increase in fortification of industrially milled maize flour is primarily due to revised data from Mexico, which is a major contributor to the global consumption of industrially milled maize.
Burundi and Malawi passed wheat and maize flour fortification legislation in 2015 as part of comprehensive food fortification regulations. Viet Nam also passed wheat flour legislation in January 2016. These countries do not represent a large share of the global wheat and maize production, however. When their fortification programs are fully implemented, people will benefit from the improved nutrition, but it will not significantly affect the global percentage of grain that is fortified.
The country profiles on the FFI website now include each country’s percentage of industrially milled grain that is fortified. If you have a correction for your country profile, please contact us at info@ffinetwork.org. You can also contact us at info@ffinetwork.org to request information from the country profiles in an Excel spreadsheet.
New Worksheet for Fortification of Rice Imports
A common assumption about rice fortification is that most rice is milled in small village mills where fortification is not cost-effective. However, our most recent estimates indicate that 230 million metric tons of rice, or 62% of the total rice available for human consumption, was industrially milled in 2015. This represents an opportunity for fortification.
Requiring fortification of rice imports may be a good first step for many countries. In 2011, 33.5 million metric tons of rice were imported by 195 countries, according to 2011 data from the Food and Agriculture Organization of the United Nations (FAO). The imported commodity is usually milled rice, rather than paddy rice which has not been milled. At various points in the imported rice supply chain, milled rice can be fortified with vitamins and mineral to improve the nutrient intake of consumers.
We developed a worksheet to help country stakeholders determine whether fortification of imported rice is practical. The worksheet is a Word document so you can enter information into the required fields. The worksheet is based on recent FFI experiences in Solomon Islands.
A rapid test that can be used by customs officials to test imports for the presence of fortified kernels is also available. See the standard operating procedures.
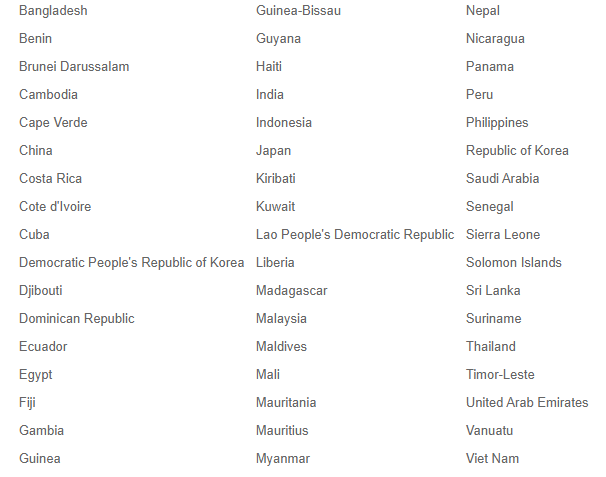
In the 51 countries listed below, more than 75 grams of rice per person per day are available for human consumption, according to FAO. The 51 countries collectively imported 16 million tons of rice in 2011. These countries in particular may want to consider fortification of imported rice to improve nutrition among their population.
Please contact Becky Tsang, FFI Technical Officer for Asia, with questions about the worksheet or about the global status of rice fortification programs noted on the map below. becky.tsang@ffinetwork.org. You can also download the map as a PowerPoint slide.
Highlights from World Birth Defects Day
Fortifying grains with folic acid was highlighted during the World Birth Defects Day observance on March 3. Here are some highlights in case you missed the news:
This story explains how collaboration and networking were required in advocacy efforts for the US to amend its grain fortification standard 20 years ago to include folic acid.
A recent study indicates that the United States saves between USD 400 million and USD 600 million every year due to grains being fortified with folic acid.
As microcephaly makes news, we assume that if a method of prevention were proven, it would be implemented. This blog questions that assumption, since fortification with folic acid as a proven method for preventing most spina bifida and anencephaly is progressing at a snail’s pace.
A new PUSH! Global Alliance was officially launched March 3. Its goal is for organizations and individuals to accelerate spina bifida and hydrocephalus prevention and to improve quality of care for those affected. The PUSH! website features report cards for countries in Africa and Southeast Asia. These are meant to offer information that can be used for improvements.
Neural tube defects are among the most common birth defects in the South-East Asia Region of the World Health Organization. A media statement from the region noted that “World Birth Defects Day… is a reminder to all of us to further commit our efforts towards ensuring a healthy and birth-defects free life for every new born.”
Three field epidemiology and laboratory training programs will are planned related to birth defects in Kenya, Nigeria, and Afghanistan. These are in collaboration with the US Centers for Disease Control and Prevention's Birth Defects COUNT global initiative.
Adding folic acid to flour to prevent neural tube birth defects is "the best thing since sliced bread" according to this new video by Godfrey Oakley, Director of the Center for Spina Bifida Prevention at Emory University.
Logos from World Birth Defects Day participating organizations are pictured below.
